Reagan

Clean Buildings Ecosystem Assessment for Washington

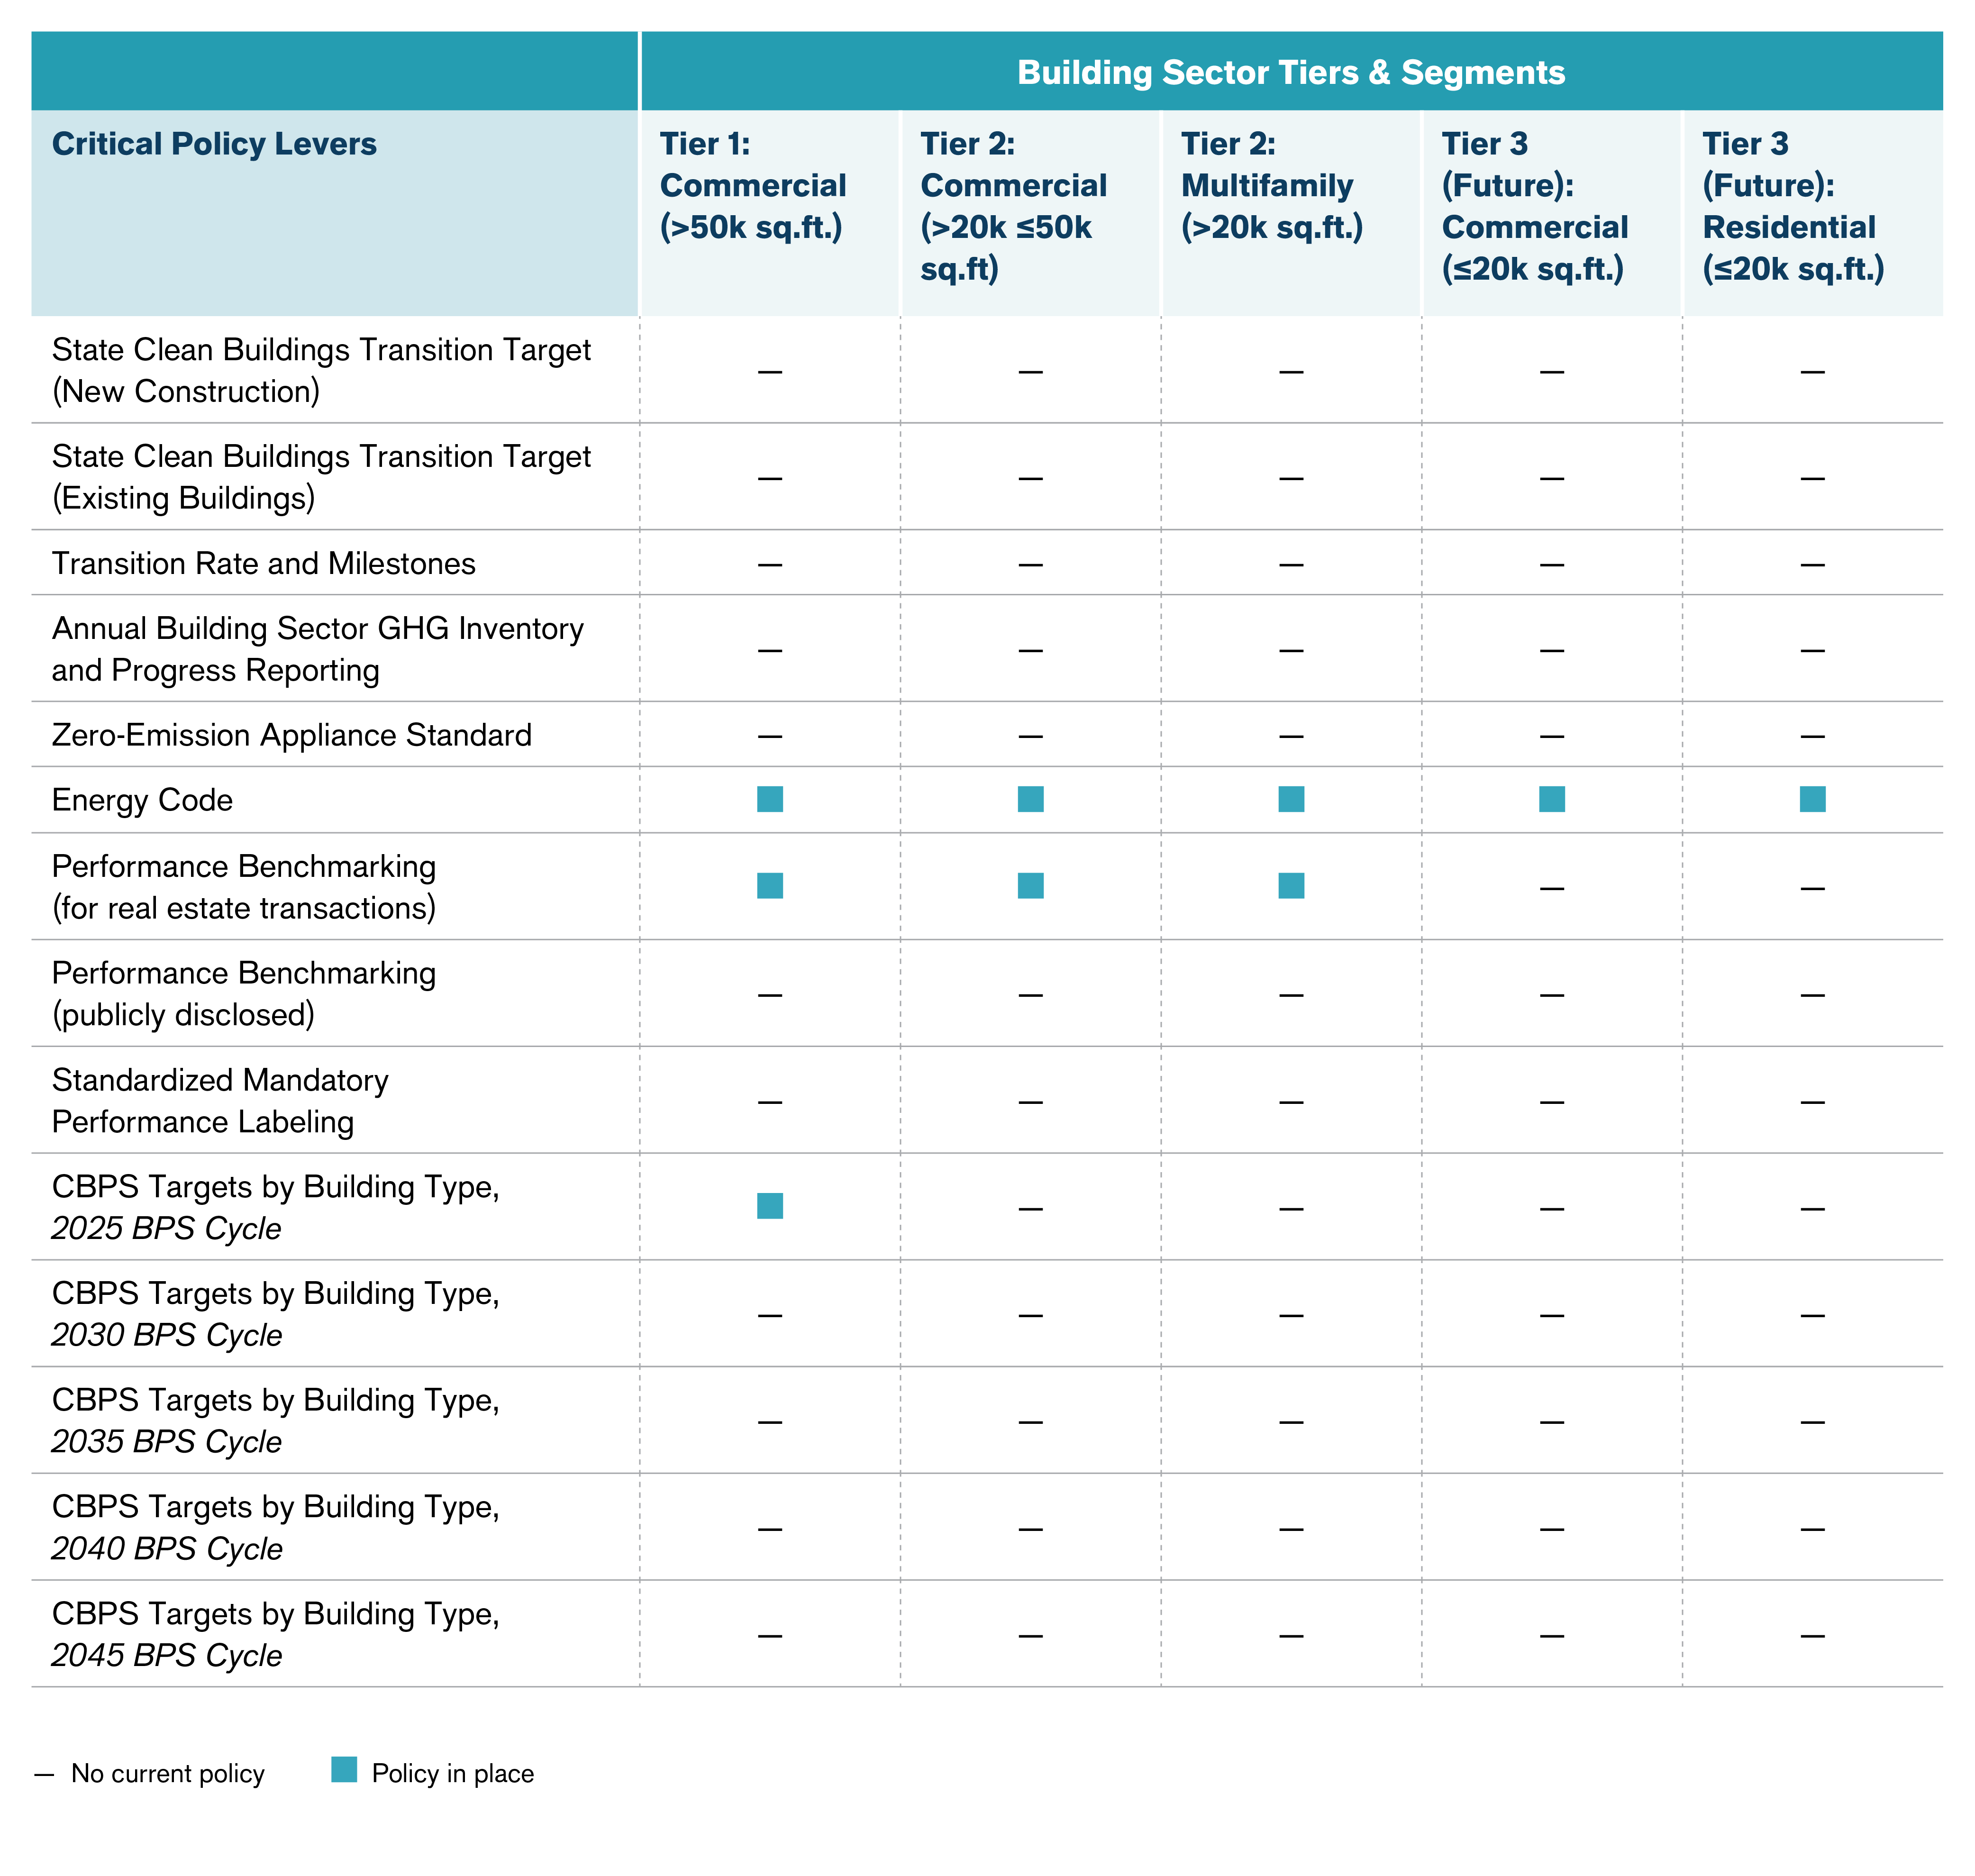
It is critical to understand the current state of Washington's building ecosystem before developing a framework, roadmap, or other efforts connected to scaling a clean buildings transition. SCALE 2030: Clean Buildings Ecosystem Assessment for Washington compiles existing data and research from state, regional, and federal sources to develop a holistic view of the existing building ecosystem in the state.

The findings in this paper inform the strategies presented in SCALE 2030: Clean Buildings Transition Framework for Washington.

Explore Ecosystem Assessment Key Findings

Emissions and Energy Use

  • Emissions in Washington’s residential and commercial buildings increased by 62% between 1990 and 2021. Counting residential and commercial buildings, building sector emissions are now 26% of the state’s total greenhouse gas emissions.
  • Buildings are the largest end use sector for both natural gas and electricity in the state. The sector consumes 77% of the state’s electricity and accounts for 42% of its natural gas consumption. Transitioning away from natural gas in buildings would reduce the state’s natural gas emissions by nearly half.
  • In 2022, the building sector spent nearly $2 billion on natural gas and $7 billion on electricity. Most natural gas consumed in Washington is imported from Canada, while Washington is a net exporter of electricity. Shifting energy use towards electricity keeps more dollars in Washington.

Building Types

  • As of 2023, Washington had 3.3 million housing units, with a high concentration of single-family and low-rise multifamily homes. Single-family homes are defined in the Northwest Energy Efficiency Alliance’s (NEEA) Residential Building Stock Assessment as detached single-family, townhomes/rowhomes, and homes within two-unit, three-unit, and four-unit buildings. Low-rise multi-family homes are defined as having one to three stories. Combined, these types of homes make up 92% of housing units. Clean buildings solutions will need to work for these majority segments.
  • Statewide, the largest commercial building types by floor area are retail/services, mixed commercial use, and warehouses. These three types make up 52% of commercial floor area. With offices and schools added, these five types make up 75% of commercial floor area. Clean buildings solutions will need to work for these types of commercial buildings.
  • Rental homes make up 1/3 of residential units in the state. Challenges unique to completing upgrades in rental units will need to be addressed

Geographic Distribution

  • To better understand how buildings are distributed across the state, the SCALE 2030 team broke the state into eight Clean Energy Regions: Olympic, Northwest, Puget Sound, Southwest, North Central, South Central, Eastern, and Southeast.
  • An estimated 66% of commercial floor area is in the Puget Sound region.
  • The Eastern region, which includes Spokane, has the second-largest concentration of commercial buildings.
  • Most other regions have less than 5% of the state’s total commercial floor area.
  • This points to the Puget Sound and Eastern regions as important areas to focus on to address commercial building decarbonization in Washington.
  • Over half of housing units are concentrated in the Puget Sound region and 79% of housing units are in western Washington.
  • The Puget Sound region could be used to pilot and establish strategies to transition the majority of units and inform tailored approaches in other regions of the state.

Building Sector Policies

  • While existing state climate policies like the Clean Energy Transformation Act (CETA) and Climate Commitment Act (CCA) establish high-level goals for clean buildings, there are large gaps in building sector-specific policies that could help advance clean buildings.
  • This table summarizes existing building sector policies (blue boxes) and policies that are needed (dashes). It is organized by Clean Building Performance Standard (CBPS) Tiers, with an added “Tier 3” that would include smaller commercial and residential buildings.
  • The analysis points to a need for more holistic policies beyond CBPS and existing energy codes.
Existing policies, programs, and market transformation efforts provide starting points for achieving a zero-emission, highly efficient, modernized building stock. However, changes are needed to deliver complete policies and regulatory pathways to transform and modernize the entire building stock. Successfully making these changes is critical to meet Washington’s goal net-zero emissions by 2050.

Barriers

  • Lack of tracking and accountability
  • Policy gaps
  • Lack of alignment between market actors and policy goals
  • Low awareness of technologies and value propositions of upgrades, and lack of time to acquire knowledge for building owners, occupants, and contractors
  • High costs of building energy upgrades and limited access to grants, incentives, or loans
  • Inconsistent access to clean buildings services and technologies across the state
  • Limited funding

Opportunities

  • Strong building code for new buildings
  • CBPS reducing energy use in large existing buildings
  • Conservation targets in I-937 that drive energy efficiency programs
  • NEEA’s existing market transformation success and exploration of whole building performance focus
  • CCA funding
  • CETA driving clean electricity
  • New Washington Builds green bank launching programs that will increase access to finance and bring in private capital
SIGN UP FOR CETI'S MAILING LIST
ROADMAPABOUTCONTACTPrivacyDONATE to ceti
Seattle, WA